Effective Scientific Schematic Development
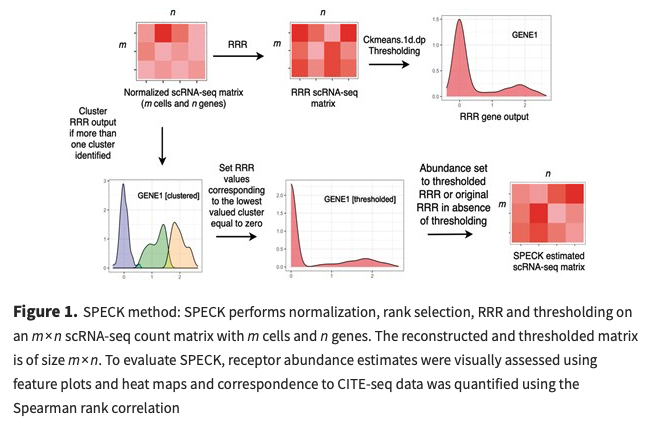
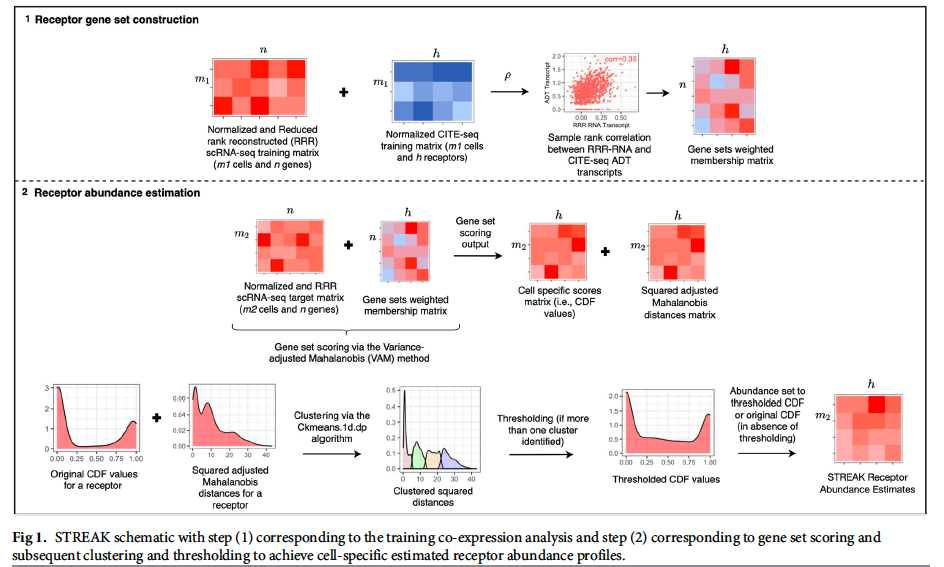
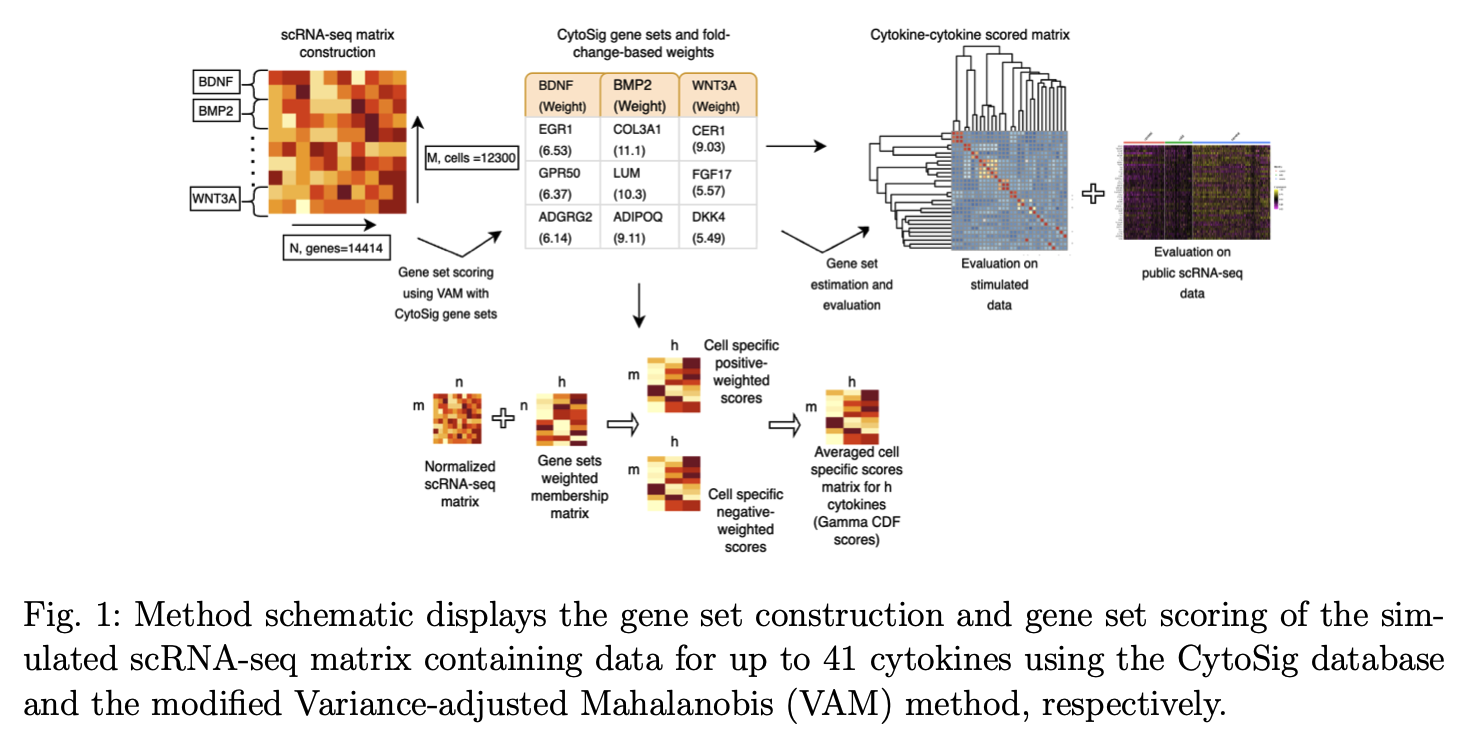
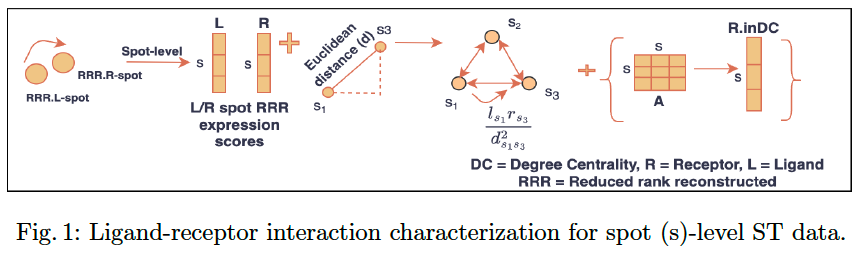
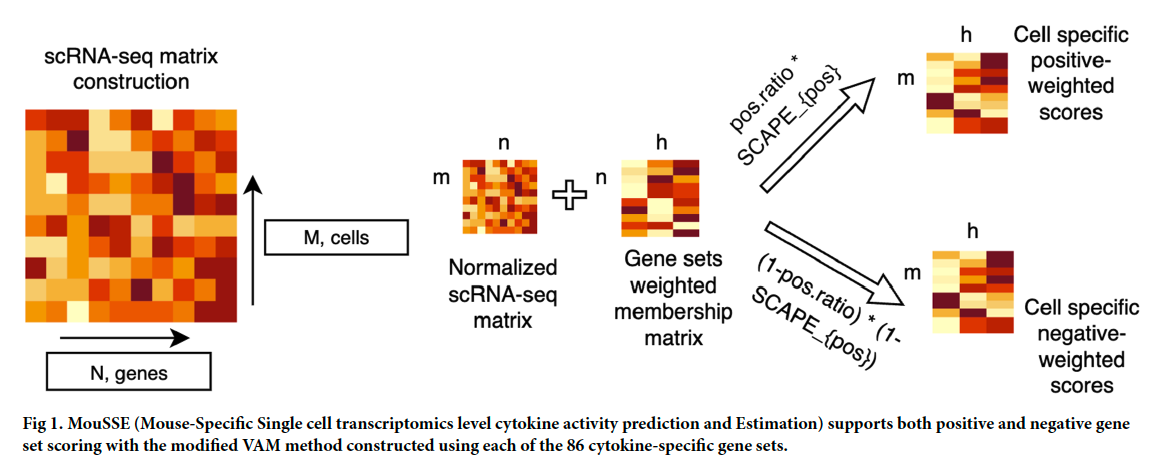
Students will learn to design clear, visually engaging scientific schematics that effectively communicate complex research concepts, methodologies, and findings. Through hands-on instruction, students will gain experience creating research workflow diagrams, conceptual frameworks, graphical abstracts, and scientific illustrations using accessible tools such as BioRender, Canva, diagrams.net (Draw.io), Microsoft PowerPoint, Google Slides, and Inkscape. Students will explore how to select appropriate visual representations, organize complex scientific information, and apply principles of visual clarity, scientific accuracy, color coordination, and effective labeling. Emphasis will be placed on developing professional, publication-ready figures that adhere to scientific communication standards and journal guidelines. By the end of the program, students will be equipped to independently develop high-quality scientific schematics for research manuscripts, conference posters, presentations, and graphical abstracts. See sample schematics (right).